Quick answer: the Netherlands has the tallest people (men 183.8 cm / 6 ft, women 170.4 cm / 5 ft 7 in). Timor-Leste has the shortest men (160.1 cm) and Guatemala the shortest women (150.9 cm). U.S. averages: 176.9 cm men, 163.3 cm women.
Average Height by Country: Tallest to Shortest
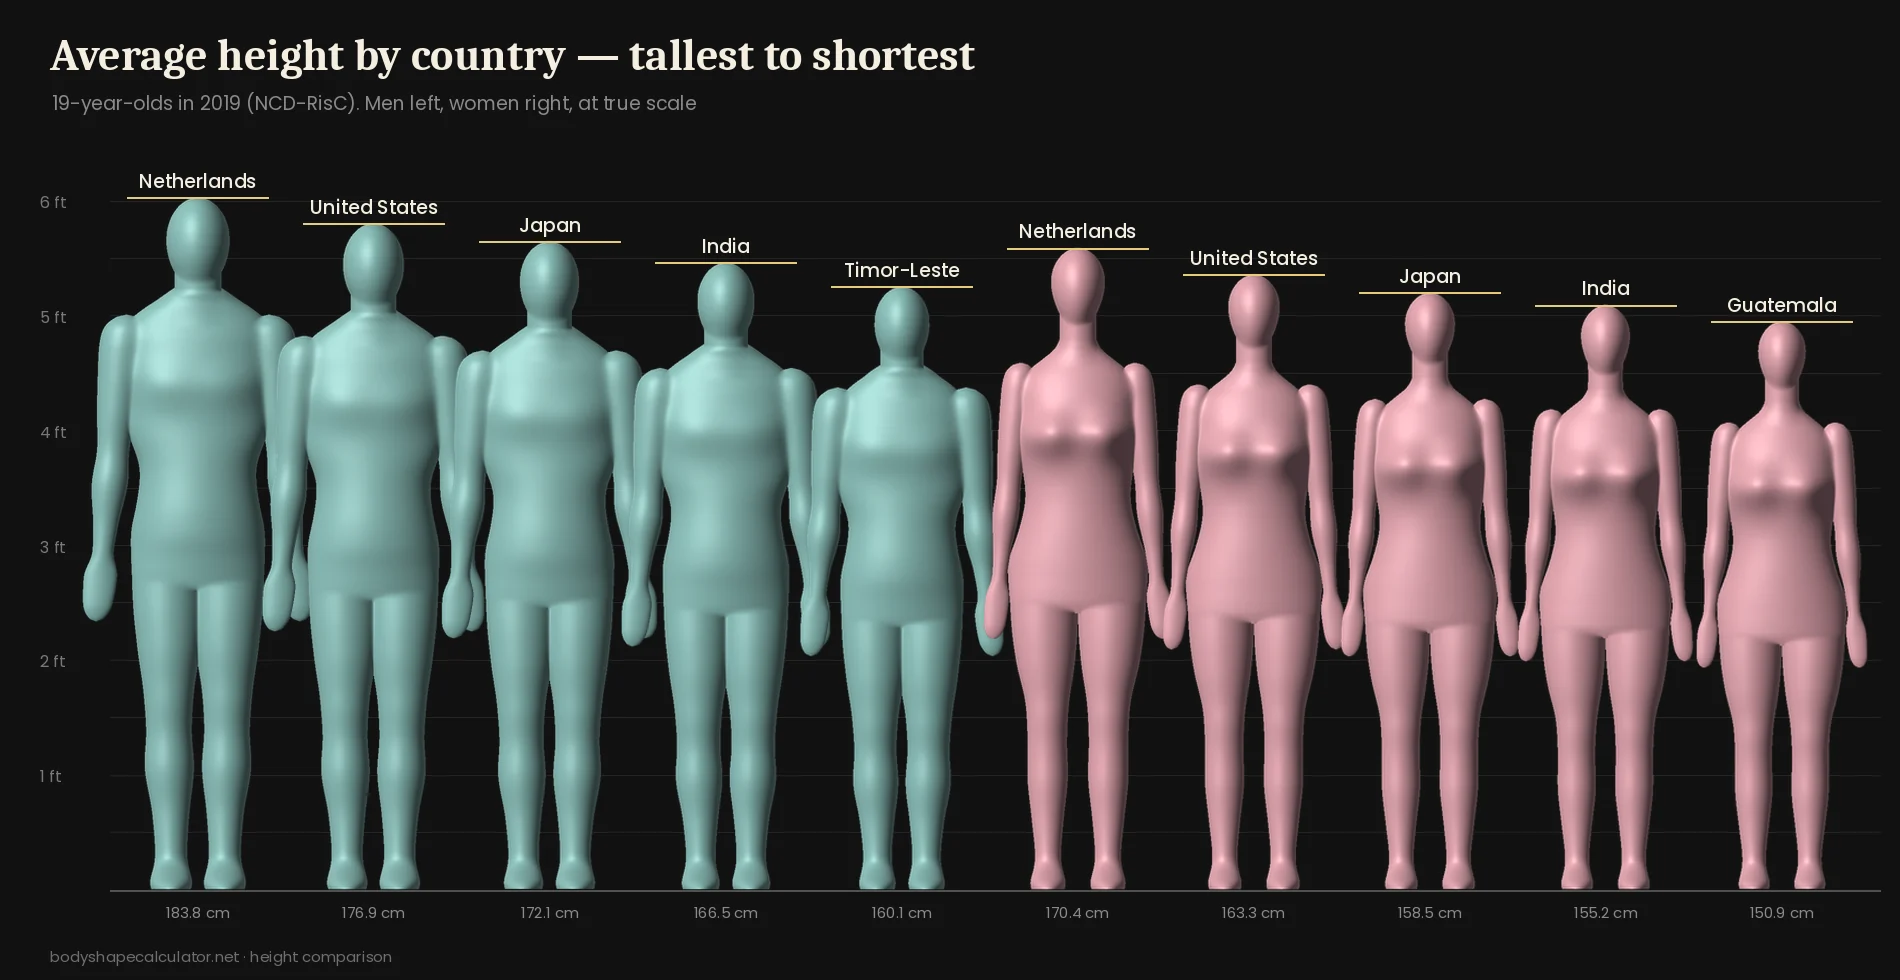
These figures are the NCD Risk Factor Collaboration’s estimates for 19-year-olds in 2019, published in The Lancet. Using one age and one year makes countries directly comparable; older adults in each country are often a little shorter.
Tallest Countries in the World
| Country | Average | Feet and inches |
|---|---|---|
| 1. Netherlands | 183.8 cm | 6 ft 0.4 in |
| 2. Montenegro | 183.3 cm | 6 ft 0.2 in |
| 3. Estonia | 182.8 cm | 6 ft 0 in |
| 4. Bosnia and Herzegovina | 182.5 cm | 5 ft 11.9 in |
| 5. Iceland | 182.1 cm | 5 ft 11.7 in |
| 6. Denmark | 181.9 cm | 5 ft 11.6 in |
| 7. Latvia | 181.2 cm | 5 ft 11.3 in |
| 8. Czech Republic | 181.2 cm | 5 ft 11.3 in |
| 9. Slovakia | 181.0 cm | 5 ft 11.3 in |
| 10. Slovenia | 181.0 cm | 5 ft 11.3 in |
Northern, central and southeastern Europe dominate: all ten of the tallest countries for men are European. Dominica, Bermuda and Puerto Rico are the tallest outside Europe.
Shortest Countries in the World
| Rank | Average | Feet and inches |
|---|---|---|
| 190. Philippines | 165.2 cm | 5 ft 5 in |
| 191. Bangladesh | 165.1 cm | 5 ft 5 in |
| 192. Yemen | 164.4 cm | 5 ft 4.7 in |
| 193. Nepal | 164.4 cm | 5 ft 4.7 in |
| 194. Guatemala | 164.4 cm | 5 ft 4.7 in |
| 195. Mozambique | 164.3 cm | 5 ft 4.7 in |
| 196. Solomon Islands | 163.1 cm | 5 ft 4.2 in |
| 197. Papua New Guinea | 163.1 cm | 5 ft 4.2 in |
| 198. Laos | 162.8 cm | 5 ft 4.1 in |
| 199. Timor-Leste | 160.1 cm | 5 ft 3 in |
The shortest averages are found in Southeast Asia, the Pacific, South Asia and parts of Africa and Central America. The gap between the tallest and shortest country is about 24 cm (9.4 in) for men.
Average Height of Women by Country
| Country | Average | Feet and inches |
|---|---|---|
| Netherlands | 170.4 cm | 5 ft 7.1 in |
| Montenegro | 170.0 cm | 5 ft 6.9 in |
| Denmark | 169.5 cm | 5 ft 6.7 in |
| Iceland | 168.9 cm | 5 ft 6.5 in |
| Latvia | 168.8 cm | 5 ft 6.5 in |
| Estonia | 168.7 cm | 5 ft 6.4 in |
| Serbia | 168.3 cm | 5 ft 6.3 in |
| Czech Republic | 168.0 cm | 5 ft 6.1 in |
| Lithuania | 167.6 cm | 5 ft 6 in |
| American Samoa | 167.6 cm | 5 ft 6 in |
| Bosnia and Herzegovina | 167.5 cm | 5 ft 5.9 in |
| Cook Islands | 167.3 cm | 5 ft 5.9 in |
| Slovenia | 167.2 cm | 5 ft 5.8 in |
| Slovakia | 167.1 cm | 5 ft 5.8 in |
| Niue | 167.0 cm | 5 ft 5.7 in |
| Belarus | 166.9 cm | 5 ft 5.7 in |
| Austria | 166.9 cm | 5 ft 5.7 in |
| Dominica | 166.9 cm | 5 ft 5.7 in |
| Croatia | 166.8 cm | 5 ft 5.7 in |
| Sweden | 166.7 cm | 5 ft 5.6 in |
| Ukraine | 166.6 cm | 5 ft 5.6 in |
| French Polynesia | 166.5 cm | 5 ft 5.6 in |
| Finland | 166.5 cm | 5 ft 5.6 in |
| Norway | 166.4 cm | 5 ft 5.5 in |
| Germany | 166.2 cm | 5 ft 5.4 in |
| Poland | 165.8 cm | 5 ft 5.3 in |
| Greece | 165.8 cm | 5 ft 5.3 in |
| Australia | 164.7 cm | 5 ft 4.8 in |
| Canada | 164.7 cm | 5 ft 4.8 in |
| New Zealand | 164.7 cm | 5 ft 4.8 in |
| France | 164.5 cm | 5 ft 4.8 in |
| Ireland | 164.5 cm | 5 ft 4.8 in |
| Russia | 164.5 cm | 5 ft 4.8 in |
| United Kingdom | 163.9 cm | 5 ft 4.5 in |
| China | 163.5 cm | 5 ft 4.4 in |
| Belgium | 163.4 cm | 5 ft 4.3 in |
| United States | 163.3 cm | 5 ft 4.3 in |
| South Korea | 163.2 cm | 5 ft 4.3 in |
| Brazil | 162.4 cm | 5 ft 3.9 in |
| Spain | 162.0 cm | 5 ft 3.8 in |
| Italy | 161.8 cm | 5 ft 3.7 in |
| Turkey | 161.8 cm | 5 ft 3.7 in |
| Argentina | 161.2 cm | 5 ft 3.5 in |
| Iran | 161.2 cm | 5 ft 3.5 in |
| Egypt | 160.9 cm | 5 ft 3.3 in |
| Japan | 158.5 cm | 5 ft 2.4 in |
| Nigeria | 158.1 cm | 5 ft 2.2 in |
| Mexico | 157.9 cm | 5 ft 2.2 in |
| India | 155.2 cm | 5 ft 1.1 in |
| Indonesia | 154.4 cm | 5 ft 0.8 in |
| Philippines | 154.1 cm | 5 ft 0.7 in |
| Timor-Leste | 152.7 cm | 5 ft 0.1 in |
| Guatemala | 150.9 cm | 4 ft 11.4 in |
The ranking for women follows the men’s closely. Dutch, Montenegrin and Danish women are the tallest, at nearly 170 cm (5 ft 7 in); Guatemalan women are the shortest, at about 151 cm.
Average Height in Major Countries
| Country | Men | Women |
|---|---|---|
| United States | 176.9 cm (5 ft 9.6 in) | 163.3 cm (5 ft 4.3 in) |
| United Kingdom | 178.2 cm (5 ft 10.2 in) | 163.9 cm (5 ft 4.5 in) |
| Canada | 178.7 cm (5 ft 10.4 in) | 164.7 cm (5 ft 4.8 in) |
| Australia | 178.8 cm (5 ft 10.4 in) | 164.7 cm (5 ft 4.8 in) |
| Germany | 180.3 cm (5 ft 11 in) | 166.2 cm (5 ft 5.4 in) |
| France | 178.6 cm (5 ft 10.3 in) | 164.5 cm (5 ft 4.8 in) |
| China | 175.7 cm (5 ft 9.2 in) | 163.5 cm (5 ft 4.4 in) |
| Japan | 172.1 cm (5 ft 7.8 in) | 158.5 cm (5 ft 2.4 in) |
| India | 166.5 cm (5 ft 5.6 in) | 155.2 cm (5 ft 1.1 in) |
| Brazil | 175.7 cm (5 ft 9.2 in) | 162.4 cm (5 ft 3.9 in) |
| Mexico | 170.3 cm (5 ft 7 in) | 157.9 cm (5 ft 2.2 in) |
| Nigeria | 171.6 cm (5 ft 7.6 in) | 158.1 cm (5 ft 2.2 in) |
| Indonesia | 166.3 cm (5 ft 5.5 in) | 154.4 cm (5 ft 0.8 in) |
| Philippines | 165.2 cm (5 ft 5 in) | 154.1 cm (5 ft 0.7 in) |
Want to see two of these side by side? Put them in the height comparison tool.
Why Height Differs Between Countries
Within any country, most of the difference between individuals is genetic. Between countries, environment matters a great deal. Children who get enough protein and calories, clean water and good health care grow closer to their genetic potential. That is why heights rose by 10 to 20 cm in many countries over the 20th century as living standards improved, and why they have stalled where childhood nutrition has not improved.
Height is also linked with health: taller populations tend to have lower risk of heart disease but slightly higher risk of some cancers. Neither tall nor short is “better”; height mostly reflects childhood conditions.
How Your Height Compares
Use the tool at the top to see where you would rank in any country. For your exact percentile among U.S. adults of your sex and age, use the height percentile calculator. To predict how tall a child will be, try the height calculator.
Average Height by Country FAQ
Which country has the tallest people?
The Netherlands. Dutch 19-year-old men average 183.8 cm (6 ft 0.4 in) and women 170.4 cm (5 ft 7.1 in), the tallest in the world in the NCD Risk Factor Collaboration’s 2019 estimates. Montenegro, Estonia, Bosnia and Herzegovina, Iceland and Denmark follow closely.
Which country has the shortest people?
For men, Timor-Leste has the lowest average at 160.1 cm (5 ft 3 in), followed by Laos, Papua New Guinea and the Solomon Islands. For women, Guatemala has the lowest average at about 150.9 cm (4 ft 11.4 in).
What is the average height in the United States?
U.S. 19-year-olds average 176.9 cm (5 ft 9.6 in) for men and 163.3 cm (5 ft 4.3 in) for women in the 2019 international estimates. Across all U.S. adults, CDC data give 5 ft 9 in for men and 5 ft 3.5 in for women; older adults are slightly shorter.
What is the average height in the world?
Worldwide, the average young man is roughly 171 to 172 cm (5 ft 7.5 in) and the average young woman roughly 159 to 160 cm (5 ft 3 in), with a gap of about 20 cm between the tallest and shortest countries.
Why are some countries taller than others?
Genes set the range, but childhood nutrition, health and living conditions decide how much of that potential people reach. Countries where children eat well and suffer fewer infections have grown much taller over the past century; Dutch men are roughly 20 cm taller than their great-great-grandparents were.
Are people getting taller?
In most countries, yes, but growth has stalled or slightly reversed in some. South Korean women and Iranian men gained more than 16 cm over the 20th century, while heights in many sub-Saharan African countries have barely changed since the 1980s.
Is 6 feet tall in other countries?
6 ft (182.9 cm) is taller than the average young man in every country except the Netherlands (183.8 cm) and Montenegro (183.3 cm), where it is just below average.
Sources
- NCD Risk Factor Collaboration (NCD-RisC). Height and body-mass index trajectories of school-aged children and adolescents from 1985 to 2019 in 200 countries and territories. The Lancet. 2020;396:1511–1524.
- NCD Risk Factor Collaboration (NCD-RisC). A century of trends in adult human height. eLife. 2016;5:e13410.
- Fryar CD, et al. Anthropometric Reference Data for Children and Adults: United States, August 2021–August 2023. NCHS, 2025.
Country averages are modelled estimates for 19-year-olds in 2019. Percentiles within a country assume a typical spread (standard deviation about 7 cm for men and 6.6 cm for women).