What Is Body Fat Percentage?
Body fat percentage is the share of your total body weight that is fat. If you weigh 180 lb and carry 36 lb of fat, your body fat percentage is 20%. Everything else (muscle, bone, water and organs) is your lean mass.
A body fat percentage chart sorts those numbers into bands such as athletic, fit, average and obese. Men and women need different charts because women carry more essential fat, the fat the body needs for hormones and reproduction. That is why 15% is lean for a woman but only fit for a man.
Two people at the same weight can look very different. Body fat percentage, unlike BMI, tells you how much of that weight is fat and how much is muscle.
Body Fat Percentage Chart for Men
Every figure below is the same 5 ft 10 in man with the same 141 lb of lean mass. Only the fat changes. The waist in each column is the size the U.S. Navy formula links to that body fat level, so the pictures match the numbers.
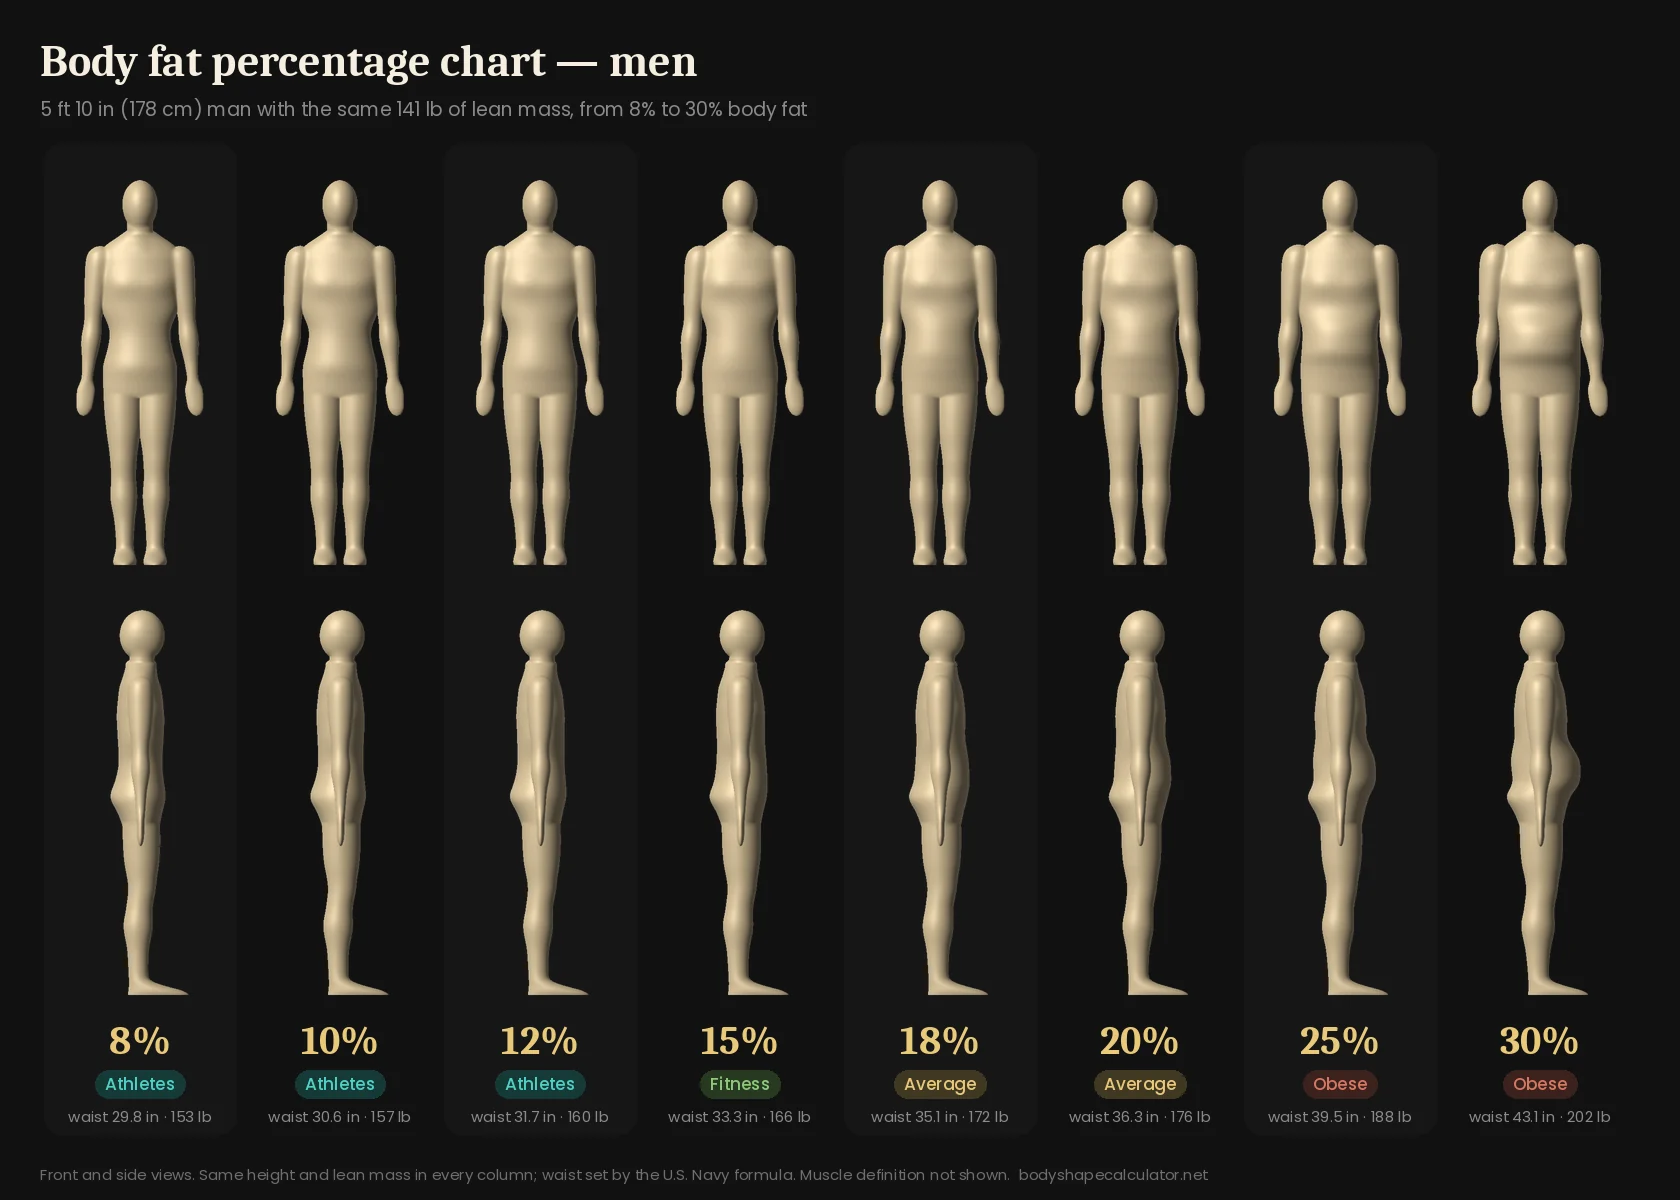
| Category | Body fat | What it usually looks like |
|---|---|---|
| Essential fat | 2–5% | Stage-ready bodybuilders on contest day. Not healthy to maintain. |
| Athletes | 6–13% | Visible abs, clear separation between muscles, veins on arms. |
| Fitness | 14–17% | Lean and fit, flat stomach, upper abs outlined in good light. |
| Average | 18–24% | Little muscle definition, softer waist, some fat over the belt. |
| Obese | 25% and up | Fat clearly around the waist and stomach, rounder face and chest. |
Body Fat Percentage Chart for Women
Here the figure is a 5 ft 5 in woman with 99 lb of lean mass. Women store more fat in the hips, thighs and chest, so the change from 15% to 35% shows up there first, not only at the waist.
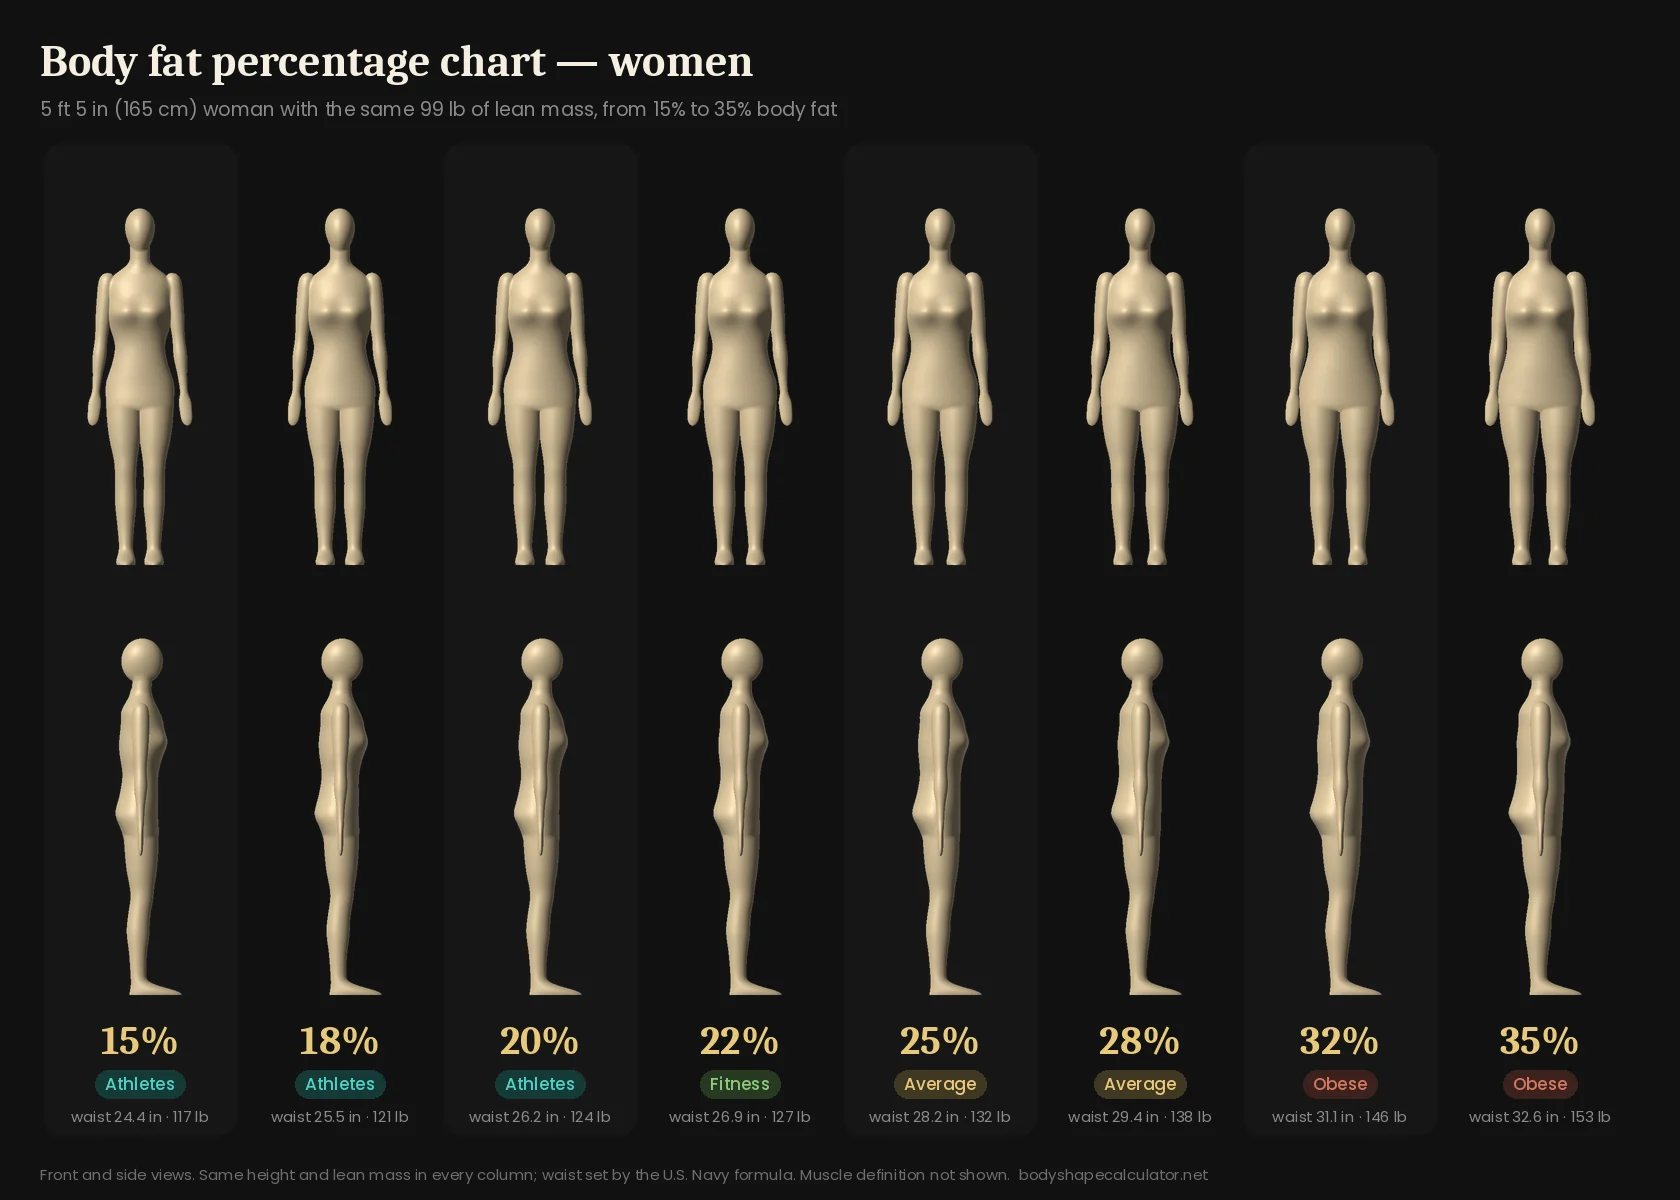
| Category | Body fat | What it usually looks like |
|---|---|---|
| Essential fat | 10–13% | Physique competitors on stage. Periods often stop; not sustainable. |
| Athletes | 14–20% | Visible abs and leg muscles, little fat on the hips and thighs. |
| Fitness | 21–24% | Toned and fit, some curve at hips and thighs, flat stomach. |
| Average | 25–31% | Softer outline, more fat on hips, thighs and lower stomach. |
| Obese | 32% and up | Fat clearly around the stomach, hips and arms; fuller face. |
The ACE chart does not adjust for age. For an age-adjusted view, use the table below. If fat is collecting mostly at your middle, also check your waist-to-hip ratio; a high ratio is common in the apple body shape.
Body Fat Percentage Chart by Age
Body fat tends to rise with age, even at the same weight, because muscle is slowly lost. The ranges below come from a study of more than 1,600 adults by Gallagher and colleagues (2000). The researchers linked body fat to the BMI cut-offs for healthy weight, overweight and obesity. They are the most widely cited age-based body fat ranges.
| Age | Healthy | Overfat | Obese |
|---|---|---|---|
| 20–39 | 8–19% | 20–24% | 25%+ |
| 40–59 | 11–21% | 22–27% | 28%+ |
| 60–79 | 13–24% | 25–29% | 30%+ |
| Age | Healthy | Overfat | Obese |
|---|---|---|---|
| 20–39 | 21–32% | 33–38% | 39%+ |
| 40–59 | 23–33% | 34–39% | 40%+ |
| 60–79 | 24–35% | 36–41% | 42%+ |
Below the healthy range is labeled underfat (for example, under 8% for men and under 21% for women aged 20–39). Lean athletes often sit there safely for a season, but staying very low for a long time carries its own risks. The ranges are for white and Black adults in the study. For Asian adults the same study found higher body fat at a given BMI (healthy roughly 13–22% for men and 25–34% for women aged 20–39).
12% Body Fat: What It Looks Like
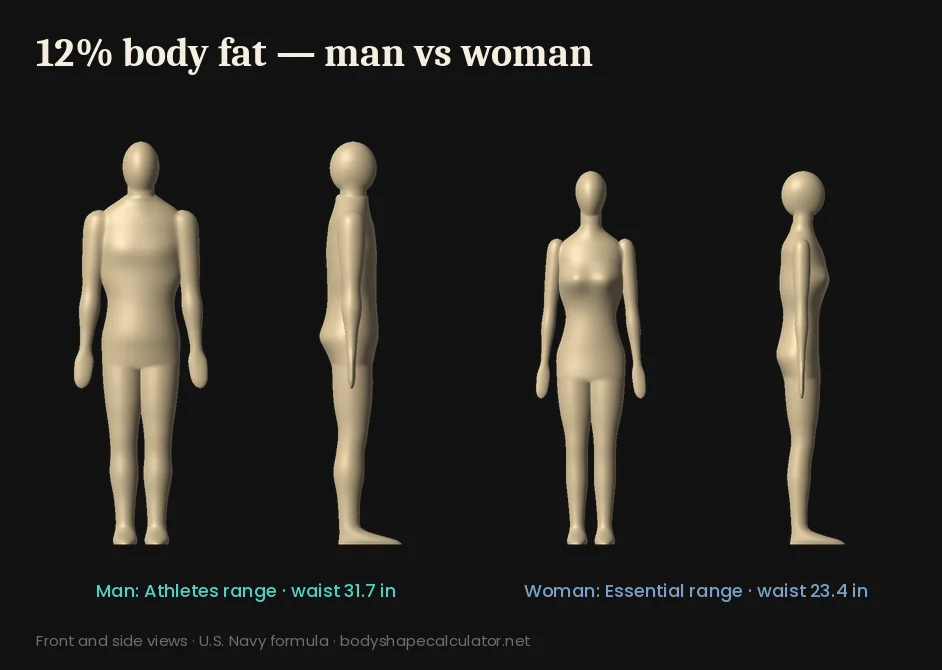
12% body fat for men
12% is in the athletes band and well inside the healthy range at any age. Most men here have a visible upper six-pack, a clear line down the middle of the stomach and visible shape in the shoulders and arms. The lower abs are often still covered. On our 5 ft 10 in reference man, 12% means a waist of about 31.7 in at about 160 lb.
It is a common “beach” or photo-shoot target. Many men can hold it with steady training and careful eating, but it takes more effort than staying at 15%.
12% body fat for women
For women, 12% is essential-fat territory (ACE: 10–13%). It is mostly seen in bodybuilding and physique competitors on stage. Periods often stop at this level, which is a sign of low energy availability (RED-S) and can weaken bones. It is not a healthy goal to maintain.
15% Body Fat: What It Looks Like
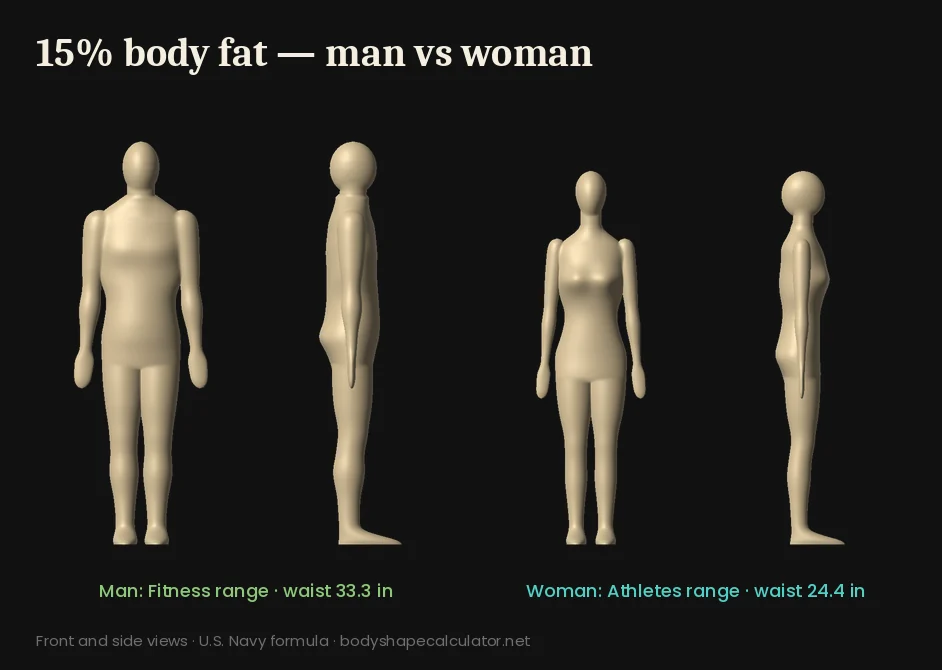
15% body fat for men
15% is in the ACE fitness band. Men here look lean and athletic in a T-shirt: a flat stomach, a defined jaw, and an outline of the upper abs when the light is right, but usually no full six-pack. For a lot of men this is the most realistic lean target to keep year-round. Our reference man measures about 33.3 in at the waist at about 166 lb.
15% body fat for women
For women, 15% sits at the low end of the athletes band. Abs, shoulders and the muscles of the thighs show clearly, and the hips and chest look smaller than usual. This is a competitive-athlete level. Some women hold it in season, but many find their hormones and energy suffer below about 17–18%.
18% Body Fat: What It Looks Like
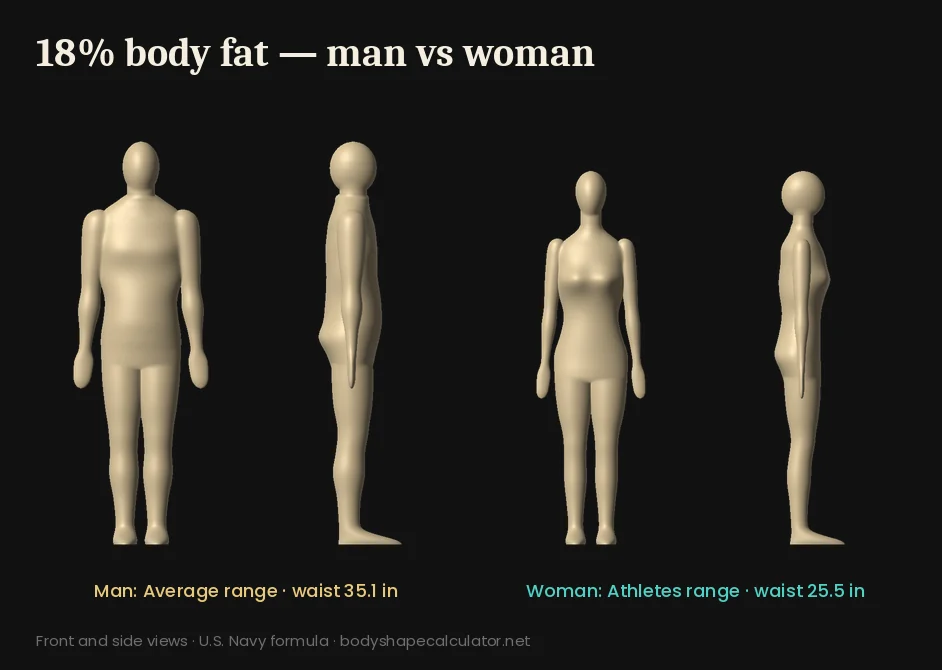
18% body fat for men
At 18% a man looks fit in clothes but soft without them. The stomach is flat or slightly rounded, there are no visible abs, and a little fat sits over the hips. ACE places 18% at the start of the average band, while the age-based table counts it as healthy for every age group. Our reference man has a waist of about 35.1 in at about 172 lb.
18% body fat for women
For a woman, 18% is lean and athletic: an outline of the abs, toned arms and legs, and only light curves at the hips. It is common in runners, dancers and CrossFit athletes. It is below the age-based healthy range (21% or higher at 20–39), so it suits athletes more than people simply aiming to be healthy.
Waist Size at Each Body Fat Percentage
Because the Navy formula links body fat to your waist, neck and height, we can turn it around and work out the waist that goes with each level. Use these tables to set a waist-size goal you can check with a tape measure. They assume a 15 in neck for men and a 13 in neck for women.
| Height | 10% | 12% | 15% | 18% | 20% | 25% |
|---|---|---|---|---|---|---|
| 5 ft 6 in | 29.7 | 30.6 | 31.9 | 33.4 | 34.4 | 37.2 |
| 5 ft 10 in | 30.5 | 31.3 | 32.8 | 34.3 | 35.4 | 38.3 |
| 6 ft 2 in | 31.2 | 32.1 | 33.6 | 35.2 | 36.3 | 39.4 |
| Height | 18% | 20% | 22% | 25% | 28% | 32% |
|---|---|---|---|---|---|---|
| 5 ft 2 in | 25.3 | 25.9 | 26.5 | 27.4 | 28.4 | 29.7 |
| 5 ft 5 in | 25.9 | 26.5 | 27.1 | 28.1 | 29.1 | 30.4 |
| 5 ft 8 in | 26.5 | 27.1 | 27.7 | 28.7 | 29.7 | 31.1 |
A thicker neck allows a slightly larger waist at the same body fat (roughly one extra inch of waist per inch of neck for men). For a single number that covers health risk, divide your waist by your height: under 0.5 is the common target. The waist-to-height ratio calculator does this for you.
How to Measure Your Body Fat at Home
The calculator at the top uses the U.S. Navy circumference method. All you need is a soft tape measure and a scale. Measure in the morning, before eating, and take each measurement twice.
- Choose sex and units. Pick male or female and inches/pounds or centimeters/kilograms. The female formula also uses your hips.
- Enter age, height and weight. Age selects the right age-based healthy range. Weight is used to split your body into fat mass and lean mass.
- Measure your neck. Wrap a soft tape just below the larynx (Adam’s apple), sloping slightly down toward the front. Keep it snug, not tight.
- Measure your waist. Men: measure around the navel. Women: measure at the narrowest point of the waist. Stand relaxed and measure after a normal breath out.
- Measure your hips (women). Stand with feet together and measure around the widest part of the buttocks, keeping the tape level.
- Read your place on the chart. The result shows your body fat percentage, your band on the ACE chart, and how it compares to the healthy range for your age.
- Preview a target. Move the target slider to see a 3D front and side view of your body at another body fat percentage, with the weight and waist size that go with it.
Not sure where your natural waist or widest hip point is? Our body measurements guide shows each tape position in 3D.
How Accurate Are Body Fat Tests?
No home method measures fat directly. Each one estimates it, so expect a margin of a few points. The errors below are typical figures reported for most adults compared with lab reference methods.
| Method | Typical error | Cost and access |
|---|---|---|
| DEXA scan | About ±1–2% | Clinic or lab; also shows bone density and fat by region |
| Hydrostatic weighing | About ±2% | University labs; you are weighed underwater |
| Air displacement (Bod Pod) | About ±2–3% | Some gyms and labs |
| Skinfold calipers | About ±3–4% | Cheap; accuracy depends on the tester |
| U.S. Navy tape method | About ±3–4% | Free; a tape measure and the calculator above |
| Smart scale (BIA) | About ±3–5% or more | Cheap; changes with hydration and time of day |
| Comparing photos to a chart | Several points | Free; muscle size and lighting easily fool the eye |
For tracking progress, the method matters less than doing it the same way each time. A tape measure is hard to beat for that: if your waist shrinks while your weight stays steady, you are losing fat and keeping muscle.
Too Low, Too High: Why Body Fat Matters
Too much body fat, especially fat stored deep in the belly, is linked to type 2 diabetes, high blood pressure, heart disease and fatty liver. Waist size is the simplest sign of that belly fat, which is why the chart and the waist tables go together.
Too little body fat has its own costs. Below the essential-fat level, hormone levels drop, bones can weaken, and in women periods may stop. Very lean levels are fine for a short competition peak but are not a long-term health goal.
For most people, getting into the healthy band for your age and keeping your waist under half your height matters much more than chasing a specific number like 10%.
See Your Own Body in 3D
The preview at the top changes only body fat. To change any measurement (shoulders, bust, hips, thighs, arms) and compare two bodies side by side, open the 3D Body Visualizer. To find out which shape your fat distribution creates, use the body shape calculator or, for men, the male body type calculator.
Body Fat Percentage FAQ
What is a healthy body fat percentage?
For adults aged 20 to 39, research by Gallagher and colleagues puts a healthy range at about 8–20% for men and 21–33% for women. The healthy range moves up a few points with age: about 11–22% (men) and 23–34% (women) at 40–59, and 13–25% (men) and 24–36% (women) at 60–79. The American Council on Exercise (ACE) chart calls 18–24% average for men and 25–31% average for women.
What does 15% body fat look like?
On most men, 15% body fat looks lean and fit: a flat stomach, visible shape in the shoulders and arms, and an outline of the upper abs in good lighting, but usually not a full six-pack. On a woman, 15% is very lean, the lower end of the athletes band, with visible ab and leg muscle definition. It is a competition level that few women can hold year-round.
Is 12% body fat good?
For a man, 12% is in the ACE athletes band (6–13%) and inside the healthy range at every age group. Most men at 12% have visible upper abs and clear muscle separation. For a woman, 12% falls in the essential-fat zone (10–13%). It is generally too low to maintain, because it can disrupt menstrual cycles, hormones and bone health.
Is 18% body fat good for a man?
Yes. For men aged 20–39, 18% is inside the healthy range (about 8–20%), and it is healthy at older ages too. On the ACE chart it is the very start of the average band. At 18% a man usually looks fit in clothes, with a flat or slightly soft stomach and no visible abs.
At what body fat percentage do abs show?
Abs commonly start to show at around 10–12% body fat for men and around 16–20% for women. The exact point depends on how thick your abdominal muscles are, where your body stores fat, and the lighting. Some people with well-developed abs see them at a higher percentage.
How accurate is the U.S. Navy body fat method?
The Navy tape method uses your height, neck, waist and (for women) hip measurements. Against lab methods it is usually within about 3–4 percentage points for most adults. It is less accurate for very muscular people and for people with obesity. Measuring the same way each time matters more than the absolute number when you track change.
Does a body fat chart change with age?
Yes. Body fat tends to rise with age, and the healthy range on age-based charts shifts up by about 3–5 points between your 20s and your 60s. The ACE chart does not adjust for age, which is why this page shows both.
What is essential body fat?
Essential fat is the minimum fat the body needs to work normally. It is found in the brain, nerves, bone marrow and organs, and in women also in breast and pelvic tissue. ACE lists about 2–5% for men and 10–13% for women. Staying at or near these levels is not healthy.
Is body fat percentage better than BMI?
Body fat percentage tells you what your weight is made of, while BMI uses only height and weight. Two people with the same BMI can carry very different amounts of fat. BMI is still useful for large groups, and waist-to-height ratio is a simple extra check on fat around the middle.
How can I lower my body fat percentage?
Eat slightly fewer calories than you burn, include enough protein, and do resistance training two to four times a week so that most of the weight you lose comes from fat, not muscle. Losing around 0.5–1% of body weight per week is a common, sustainable pace. Talk to a doctor first if you have a health condition.
Sources
- American Council on Exercise. Percent Body Fat Calculator and norms chart. acefitness.org.
- Gallagher D, Heymsfield SB, Heo M, et al. Healthy percentage body fat ranges: an approach for developing guidelines based on body mass index. American Journal of Clinical Nutrition. 2000;72(3):694–701.
- Hodgdon JA, Beckett MB. Prediction of percent body fat for U.S. Navy men and women from body circumferences and height. Naval Health Research Center, Reports 84-11 and 84-29, 1984.
- Mountjoy M, et al. IOC consensus statement on Relative Energy Deficiency in Sport (RED-S). British Journal of Sports Medicine. 2018;52:687–697.
This page is for education only and is not medical advice. Body fat estimates have a margin of error; talk to a healthcare professional about your own health.