Quick answer: the median U.S. man is about 5 ft 9 in and the median woman about 5 ft 3.5 in. A 6 ft man is at about the 87th percentile; a 5 ft 7 in woman at about the 90th.
Height Percentile Chart
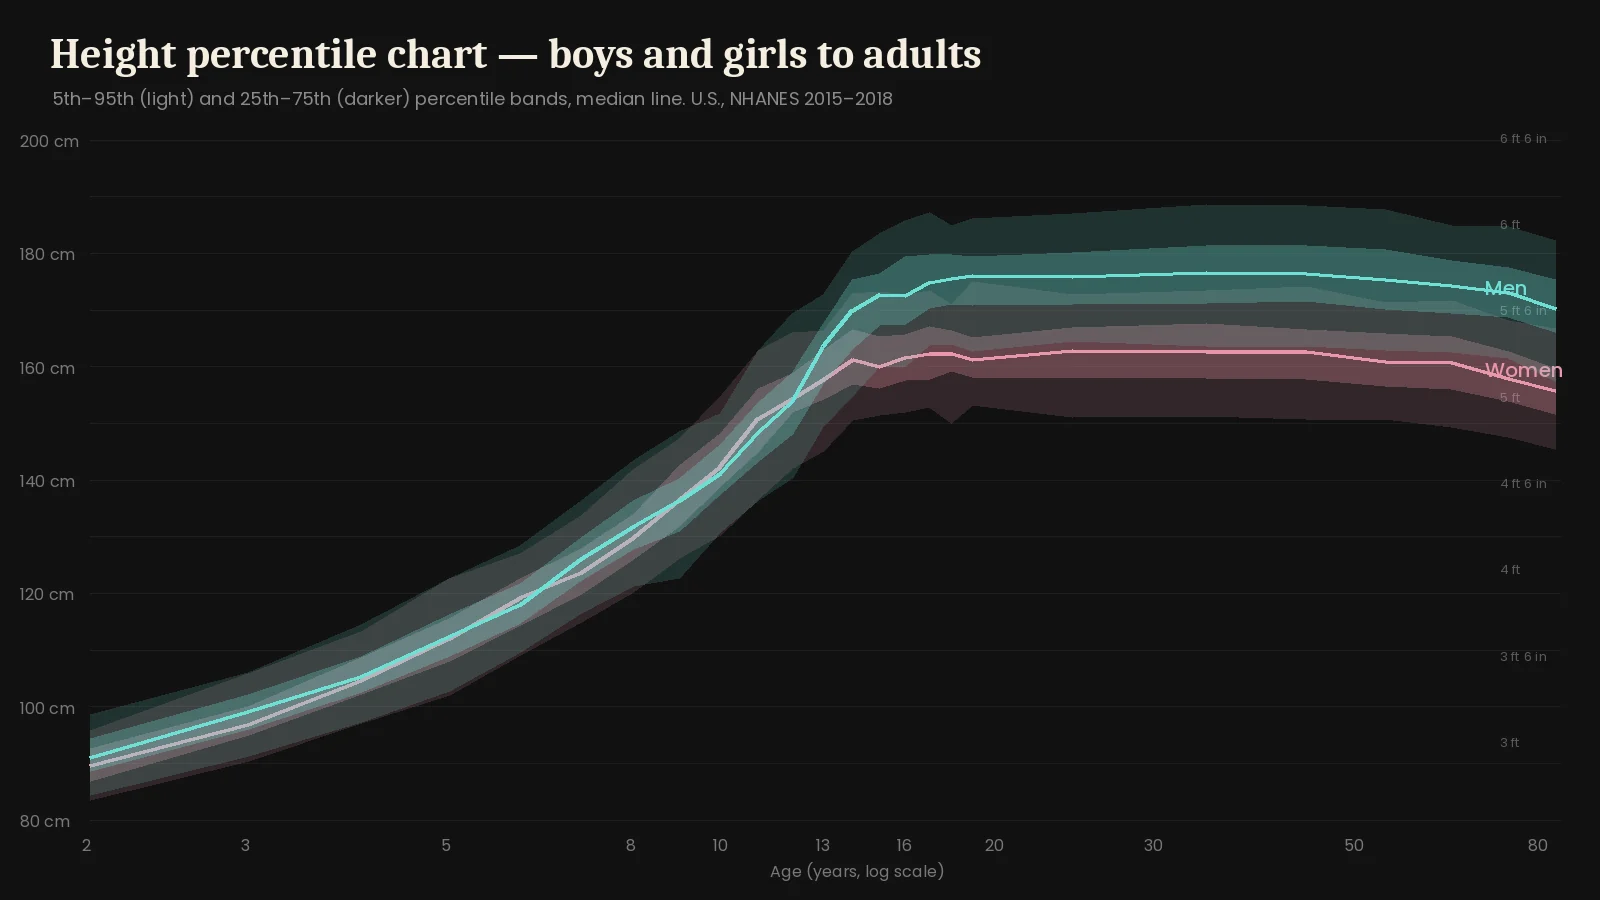
Boys and girls grow at nearly the same rate until about age 10. Girls then have their growth spurt earlier and stop growing around 15 to 16; boys keep growing until about 17 to 19, which opens the adult gap of about 13 cm (5 in).
Height Percentiles for Men
| Height | Percentile |
|---|---|
| 5′4″ (162.6 cm) | 5th |
| 5′6″ (167.6 cm) | 16th |
| 5′8″ (172.7 cm) | 37th |
| 5′9″ (175.3 cm) | 51st |
| 5′10″ (177.8 cm) | 65th |
| 6′0″ (182.9 cm) | 87th |
| 6′2″ (188.0 cm) | 97th |
| 6′4″ (193.0 cm) | 99th |
| Age | 5th | 25th | 50th | 75th | 95th |
|---|---|---|---|---|---|
| 20–29 | 5′4.8″ | 5′7.3″ | 5′9.3″ | 5′10.9″ | 6′1.7″ |
| 30–39 | 5′4.4″ | 5′7.4″ | 5′9.6″ | 5′11.4″ | 6′2.3″ |
| 40–49 | 5′4.4″ | 5′7.5″ | 5′9.5″ | 5′11.4″ | 6′2.2″ |
| 50–59 | 5′4.1″ | 5′7″ | 5′9″ | 5′11.1″ | 6′1.9″ |
| 60–69 | 5′4″ | 5′6.7″ | 5′8.6″ | 5′10.4″ | 6′0.8″ |
| 70–79 | 5′3.6″ | 5′6.4″ | 5′8.1″ | 5′9.9″ | 6′0.7″ |
| 80+ | 5′2″ | 5′5.4″ | 5′7″ | 5′9″ | 5′11.8″ |
Height Percentiles for Women
| Height | Percentile |
|---|---|
| 4′11″ (149.9 cm) | 5th |
| 5′1″ (154.9 cm) | 19th |
| 5′3″ (160.0 cm) | 43rd |
| 5′4″ (162.6 cm) | 57th |
| 5′5″ (165.1 cm) | 71st |
| 5′7″ (170.2 cm) | 90th |
| 5′9″ (175.3 cm) | 98th |
| 5′11″ (180.3 cm) | 99th |
| Age | 5th | 25th | 50th | 75th | 95th |
|---|---|---|---|---|---|
| 20–29 | 4′11.4″ | 5′2.2″ | 5′4.1″ | 5′5.7″ | 5′8″ |
| 30–39 | 4′11.5″ | 5′2.2″ | 5′4″ | 5′6″ | 5′8.3″ |
| 40–49 | 4′11.3″ | 5′2.1″ | 5′4″ | 5′5.6″ | 5′8.6″ |
| 50–59 | 4′11.3″ | 5′1.6″ | 5′3.3″ | 5′5.3″ | 5′7.5″ |
| 60–69 | 4′10.8″ | 5′1.4″ | 5′3.3″ | 5′5.1″ | 5′7.6″ |
| 70–79 | 4′10.1″ | 5′0.6″ | 5′2.2″ | 5′4″ | 5′6.2″ |
| 80+ | 4′9.2″ | 4′11.6″ | 5′1.3″ | 5′2.9″ | 5′5.6″ |
Height Percentiles for Children
| Age | Boys | Girls |
|---|---|---|
| 2 | 2′11.9″ (91.1 cm) | 2′11.3″ (89.7 cm) |
| 3 | 3′3.1″ (99.2 cm) | 3′2.1″ (96.9 cm) |
| 4 | 3′5.5″ (105.4 cm) | 3′5.2″ (104.6 cm) |
| 5 | 3′8.3″ (112.4 cm) | 3′8.1″ (112.1 cm) |
| 6 | 3′10.5″ (118.0 cm) | 3′11″ (119.3 cm) |
| 7 | 4′1.6″ (126.1 cm) | 4′0.7″ (123.7 cm) |
| 8 | 4′3.9″ (131.8 cm) | 4′3.1″ (129.8 cm) |
| 9 | 4′5.7″ (136.4 cm) | 4′5.7″ (136.5 cm) |
| 10 | 4′7.6″ (141.1 cm) | 4′8″ (142.3 cm) |
| 11 | 4′10.4″ (148.3 cm) | 4′11.4″ (150.8 cm) |
| 12 | 5′0.6″ (153.9 cm) | 5′0.7″ (154.3 cm) |
| 13 | 5′4.4″ (163.6 cm) | 5′2.1″ (157.7 cm) |
| 14 | 5′6.9″ (170.0 cm) | 5′3.5″ (161.2 cm) |
| 15 | 5′8″ (172.7 cm) | 5′3″ (160.0 cm) |
| 16 | 5′8″ (172.6 cm) | 5′3.7″ (161.7 cm) |
| 17 | 5′8.9″ (174.9 cm) | 5′3.9″ (162.4 cm) |
| 18 | 5′9.1″ (175.5 cm) | 5′3.9″ (162.3 cm) |
| 19 | 5′9.3″ (176.1 cm) | 5′3.5″ (161.2 cm) |
For young children, pediatricians use the CDC growth charts (WHO charts under age 2), which are based on the same national data. Percentiles from this calculator are a quick reference, not a medical assessment. To estimate how tall a child will be as an adult, use the height calculator.
How Height Percentiles Are Calculated
This calculator compares your height with measured heights of thousands of Americans from the National Health and Nutrition Examination Survey (NHANES), 2015–2018. The survey publishes the 5th, 25th, 50th, 75th and 95th percentiles for each age; we interpolate between them, and between ages for children, to estimate your exact percentile.
Heights are measured barefoot by trained staff. If you measured yourself in shoes or late in the day, your number may differ by 1 to 3 cm. Need a conversion? See cm to feet and inches.
Compare Your Height in Other Ways
See how you would rank in other countries with average height by country, or put yourself next to friends, family or a partner in the height comparison tool.
Height Percentile FAQ
What percentile is 6 feet for a man?
A 6 ft (182.9 cm) man is at about the 87th percentile of U.S. men aged 20 and over, so roughly 13 in 100 men are 6 ft or taller.
What percentile is 5 feet 10 inches?
For a U.S. man, 5 ft 10 in (177.8 cm) is about the 65th percentile. For a U.S. woman it is about the 99th percentile, very tall.
What percentile is 5 feet 4 inches for a woman?
5 ft 4 in (162.6 cm) is about the 57th percentile for U.S. women aged 20 and over, just above the median of 5 ft 3.5 in.
What is the average height in the U.S.?
The average U.S. adult man is 5 ft 9 in (175 cm) and the average woman 5 ft 3.5 in (161 cm), according to NHANES 2021–2023.
What does a height percentile mean?
A height percentile tells you the share of people of the same sex and age who are shorter than you. At the 70th percentile, you are taller than about 70 out of 100 people like you.
What height percentile is normal for a child?
Any percentile between the 5th and 95th is generally considered within the normal range. Doctors pay more attention to a child who stays steadily on their own curve than to the number itself, and look closer if a child crosses two major percentile lines.
Why do adults lose height with age?
Spinal discs slowly compress and posture changes with age, so most people lose 1 to 3 cm by their 70s, and more with osteoporosis. That is part of why older age groups have lower median heights.
Sources
- Fryar CD, Carroll MD, Gu Q, Afful J, Ogden CL. Anthropometric Reference Data for Children and Adults: United States, 2015–2018. Vital and Health Statistics, Series 3, No. 46. NCHS, 2021.
- Fryar CD, et al. Anthropometric Reference Data for Children and Adults: United States, August 2021–August 2023. NCHS, 2025.
- Centers for Disease Control and Prevention. CDC Growth Charts.
Percentiles between published points are interpolated. For children, this is a reference tool, not a substitute for a pediatrician’s growth assessment.